plot(sim$net)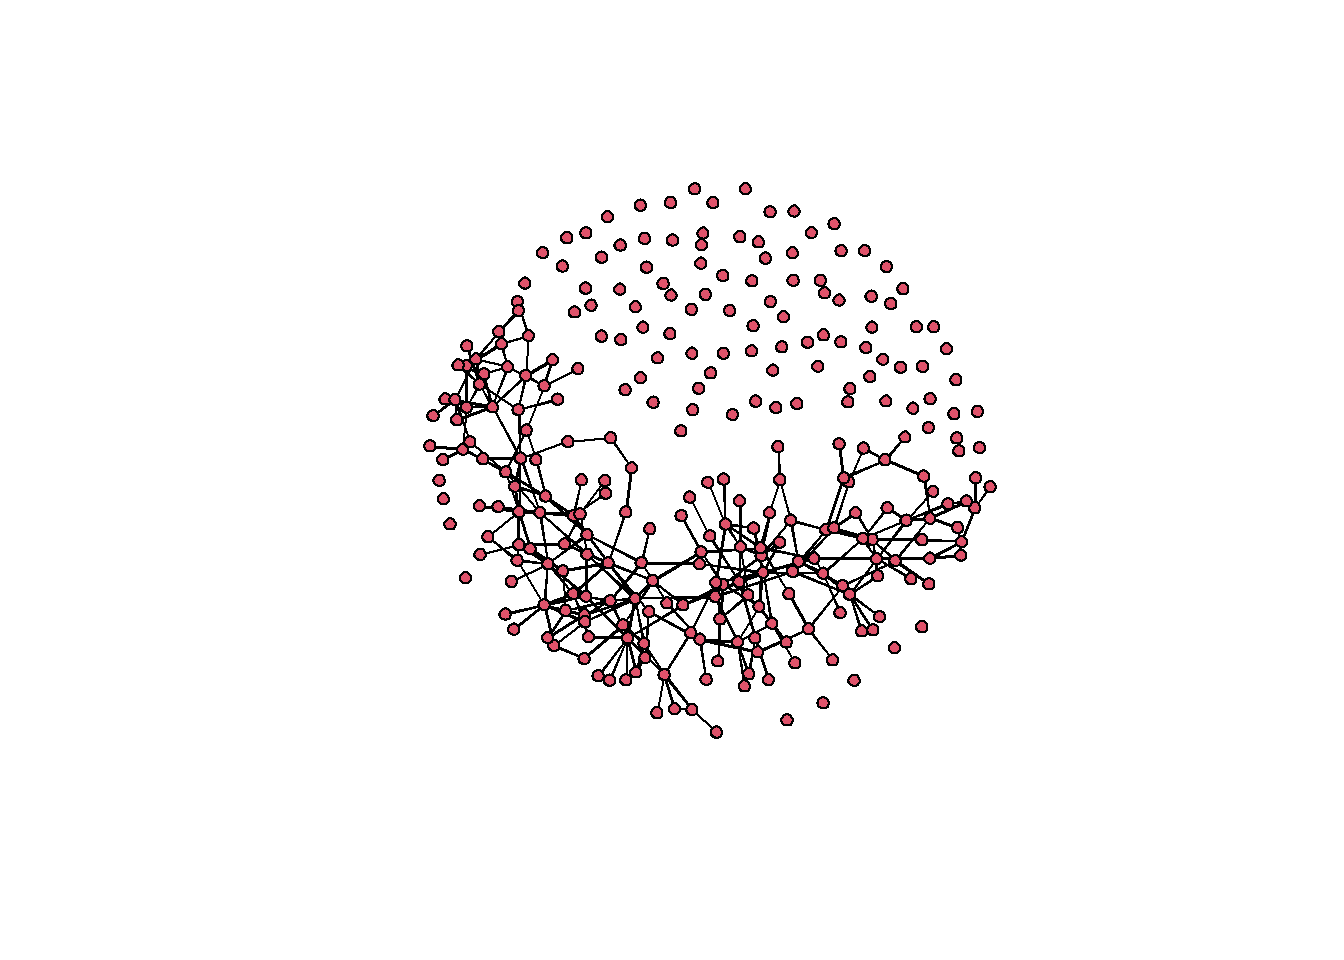
Package tooling i.e. debugging plots, ks-test etc.
A number of diagnostic plots are available for events and fit objects.
For the examples here, we will be using the fitted model from the previous section:
plot(sim$net)
You can see all the network diagnostic plots available here:
# Network diagnostic plots (2 columns)
types_net <- c("size", "edges_vs_nodes", "degree_hist", "degree_ccdf")

oldpar <- par(no.readonly = TRUE)
on.exit(par(oldpar), add = TRUE)

par(mfrow = c(ceiling(length(types_net) / 2), 2), mar = c(4, 4, 2, 1))
invisible(lapply(types_net, function(tp) plot(sim$ev, type = tp)))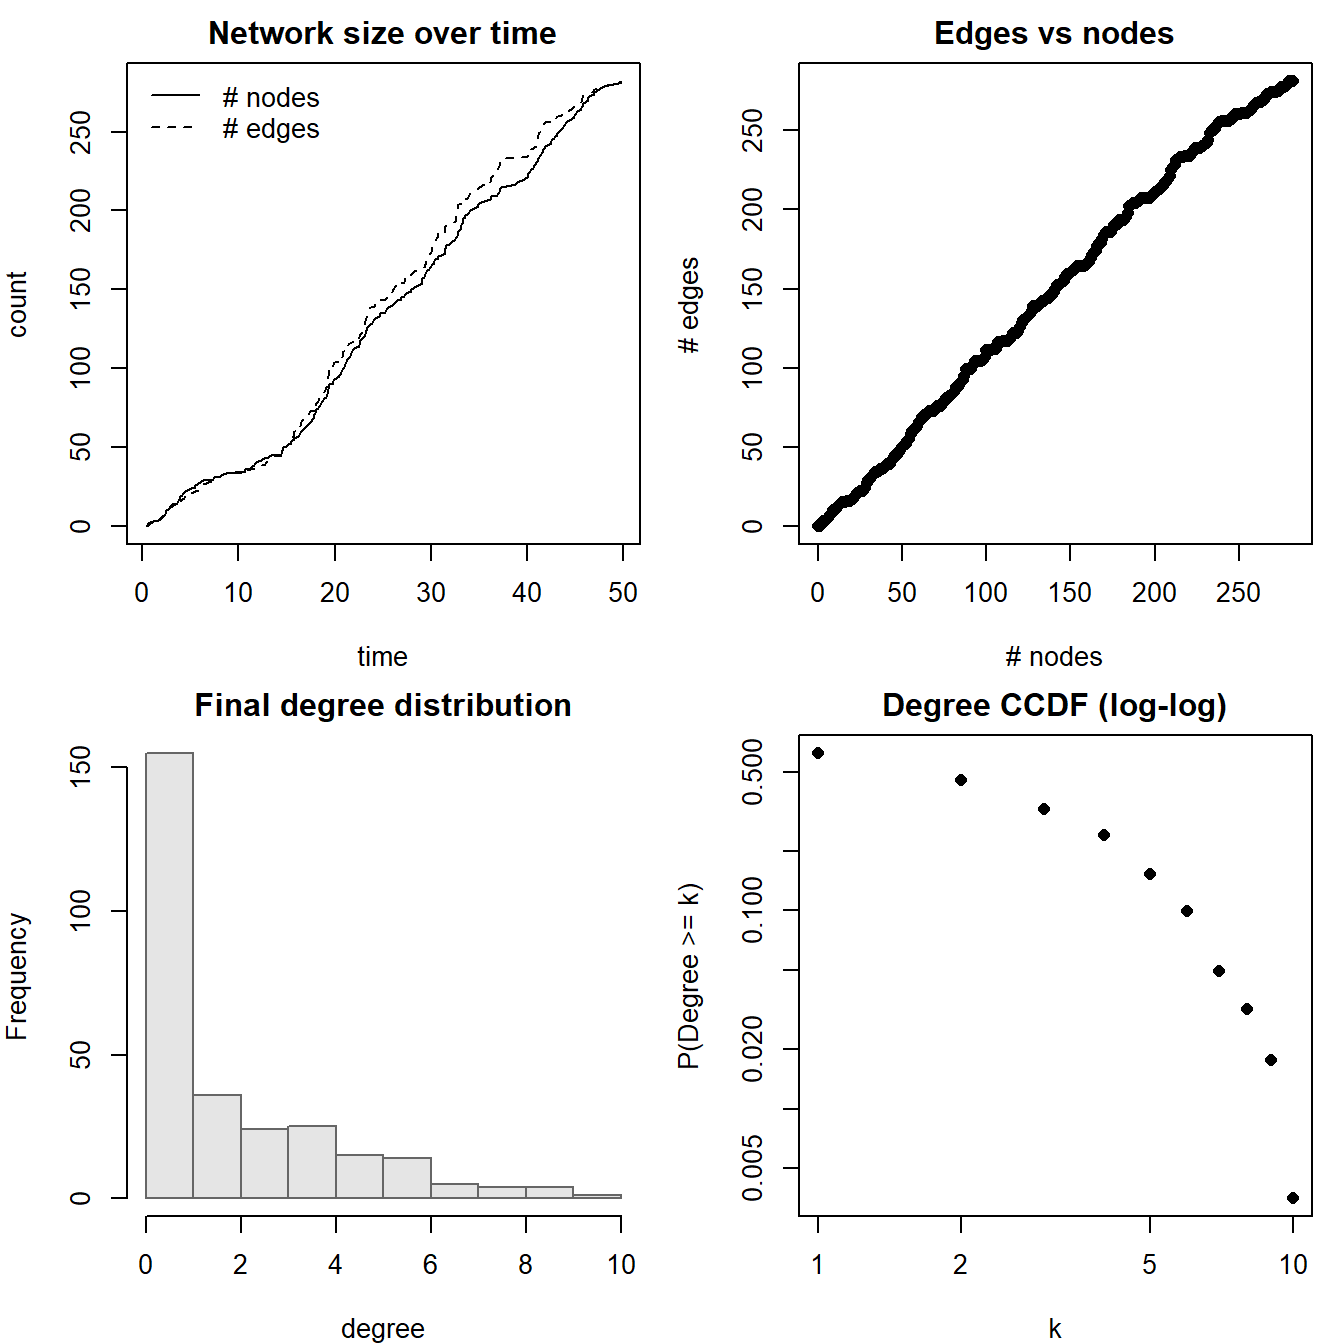
You can see all the network diagnostic plots available here:
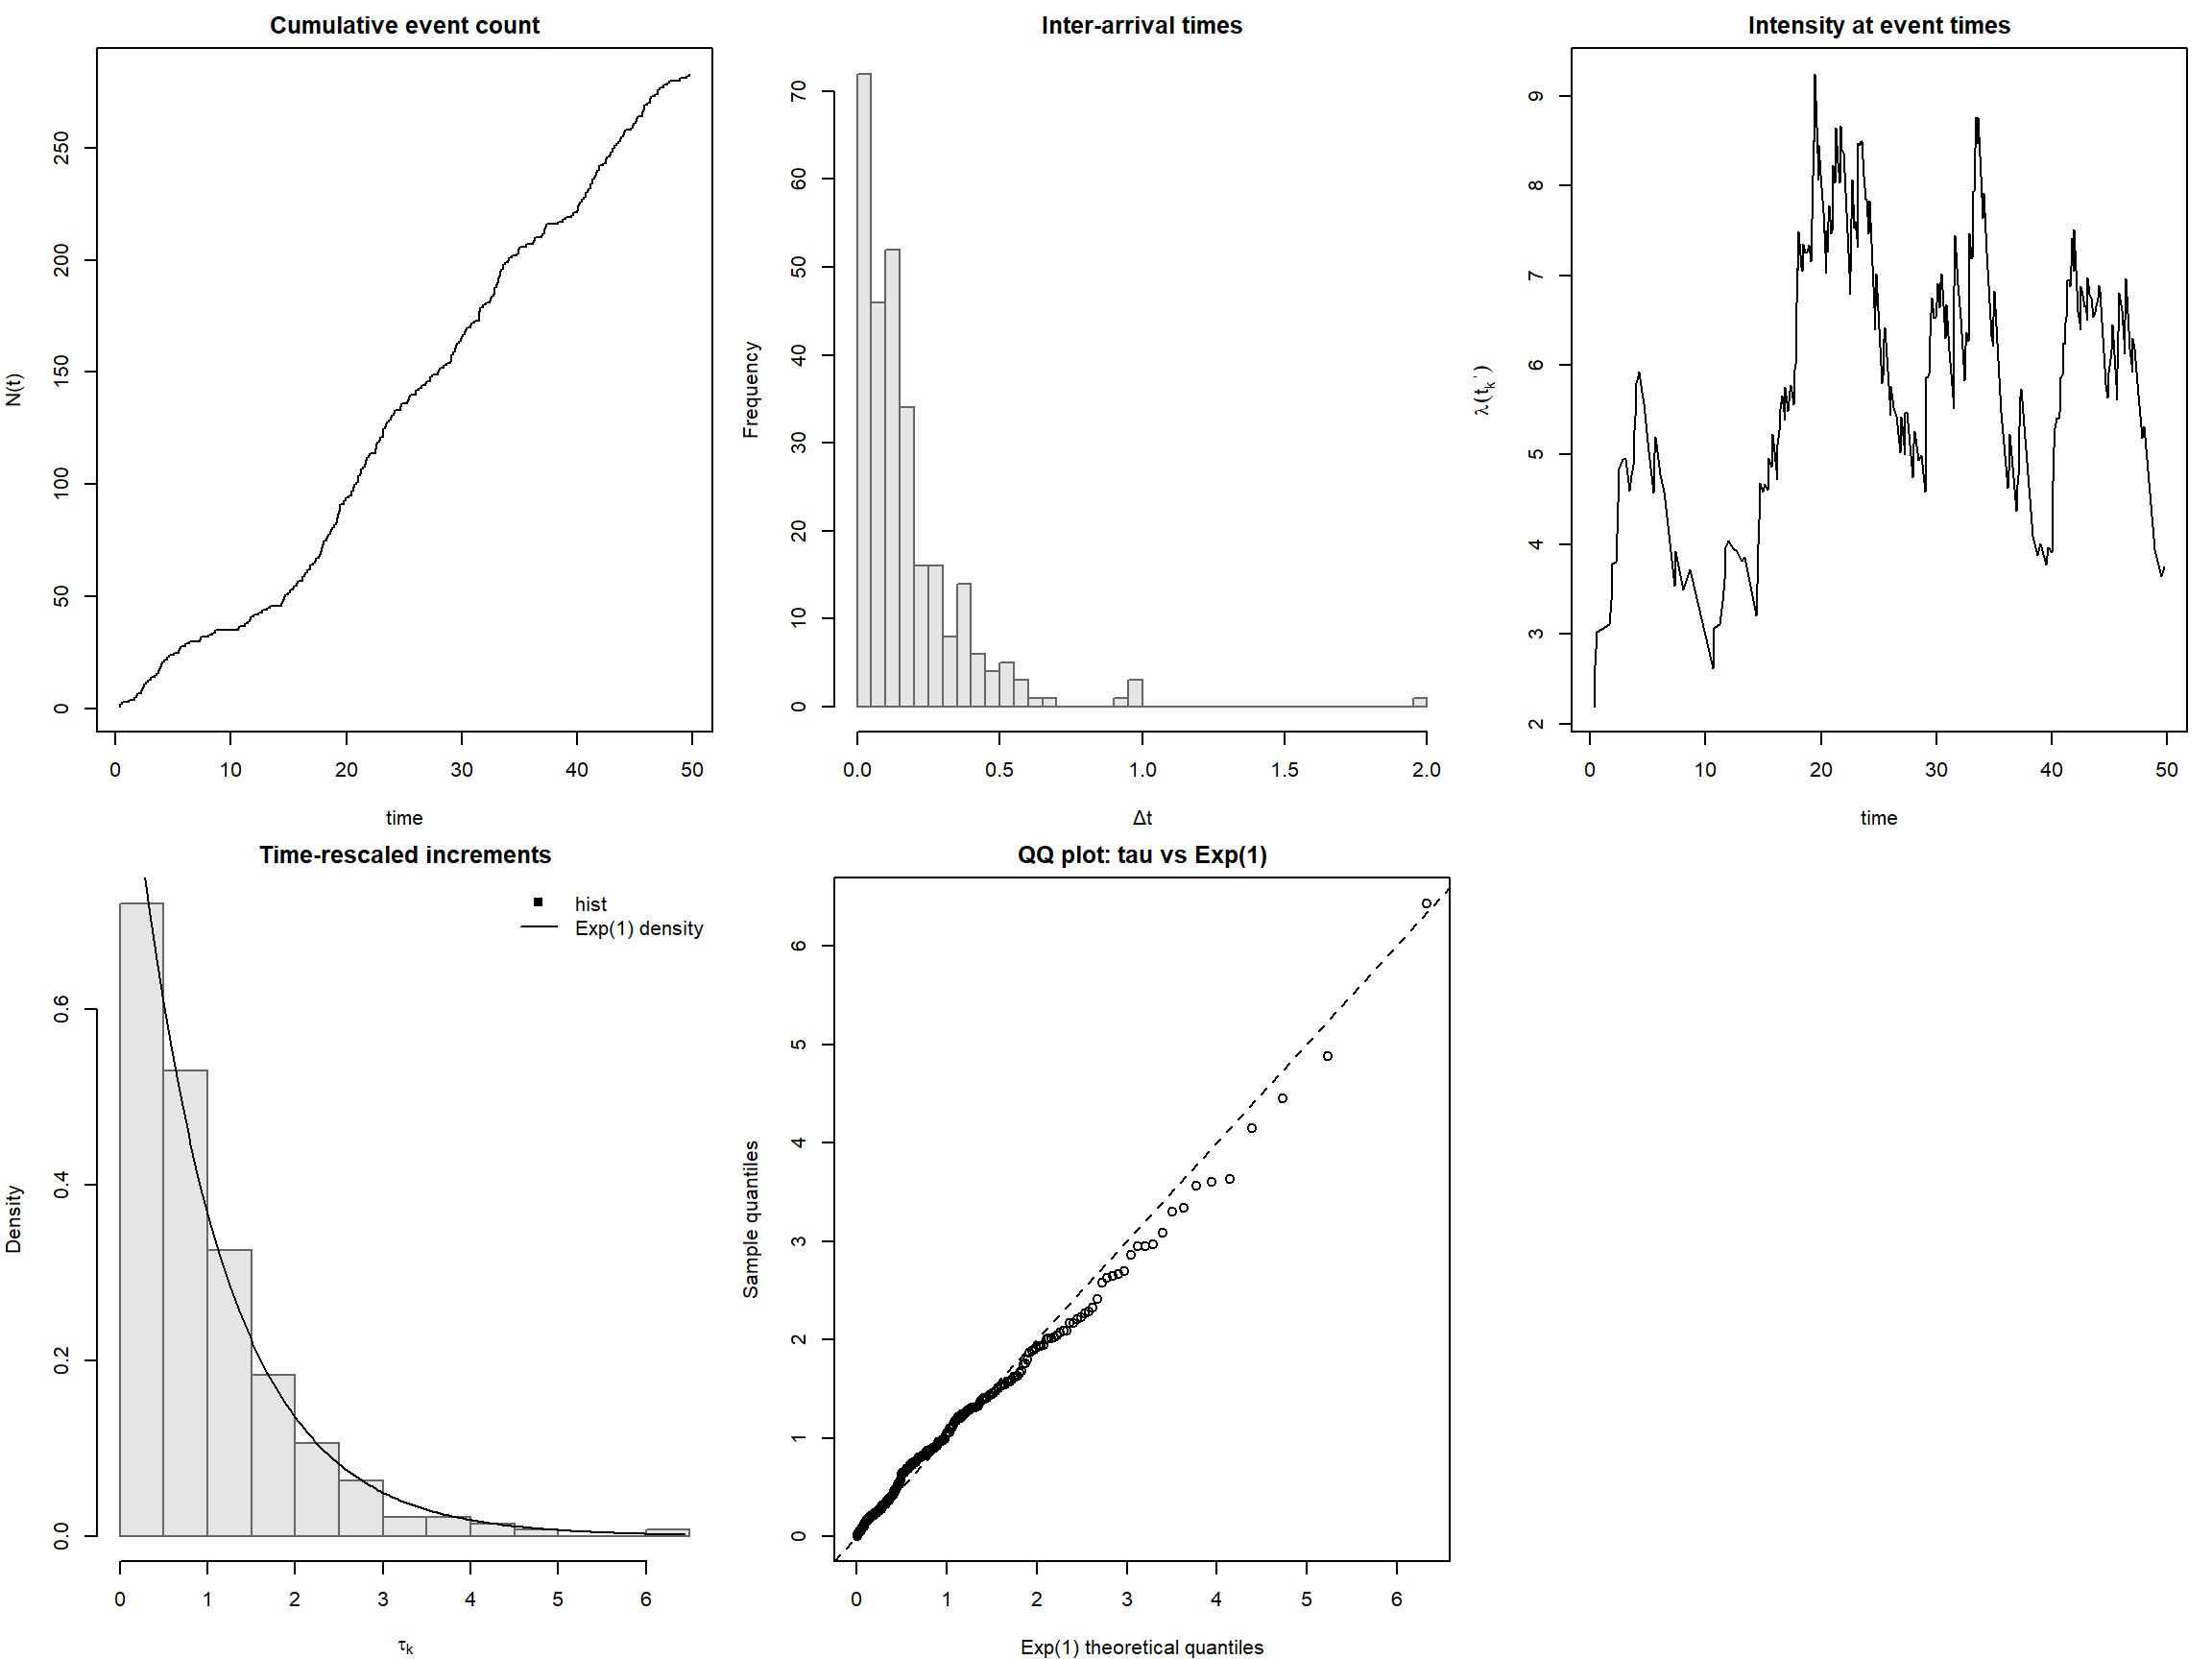
types_time <- c("count", "dt", "lambda", "tau_hist", "tau_qq")

oldpar <- par(no.readonly = TRUE)
on.exit(par(oldpar), add = TRUE)

par(mfrow = c(2, 3), mar = c(4, 4, 2, 1))

for (tp in types_time) {
  plot(fit, type = tp)
}

plot.new()