15  CS Kernel Sim Study

15.1 Quick summary

Sorry, for some reason the simulation times failed to save?
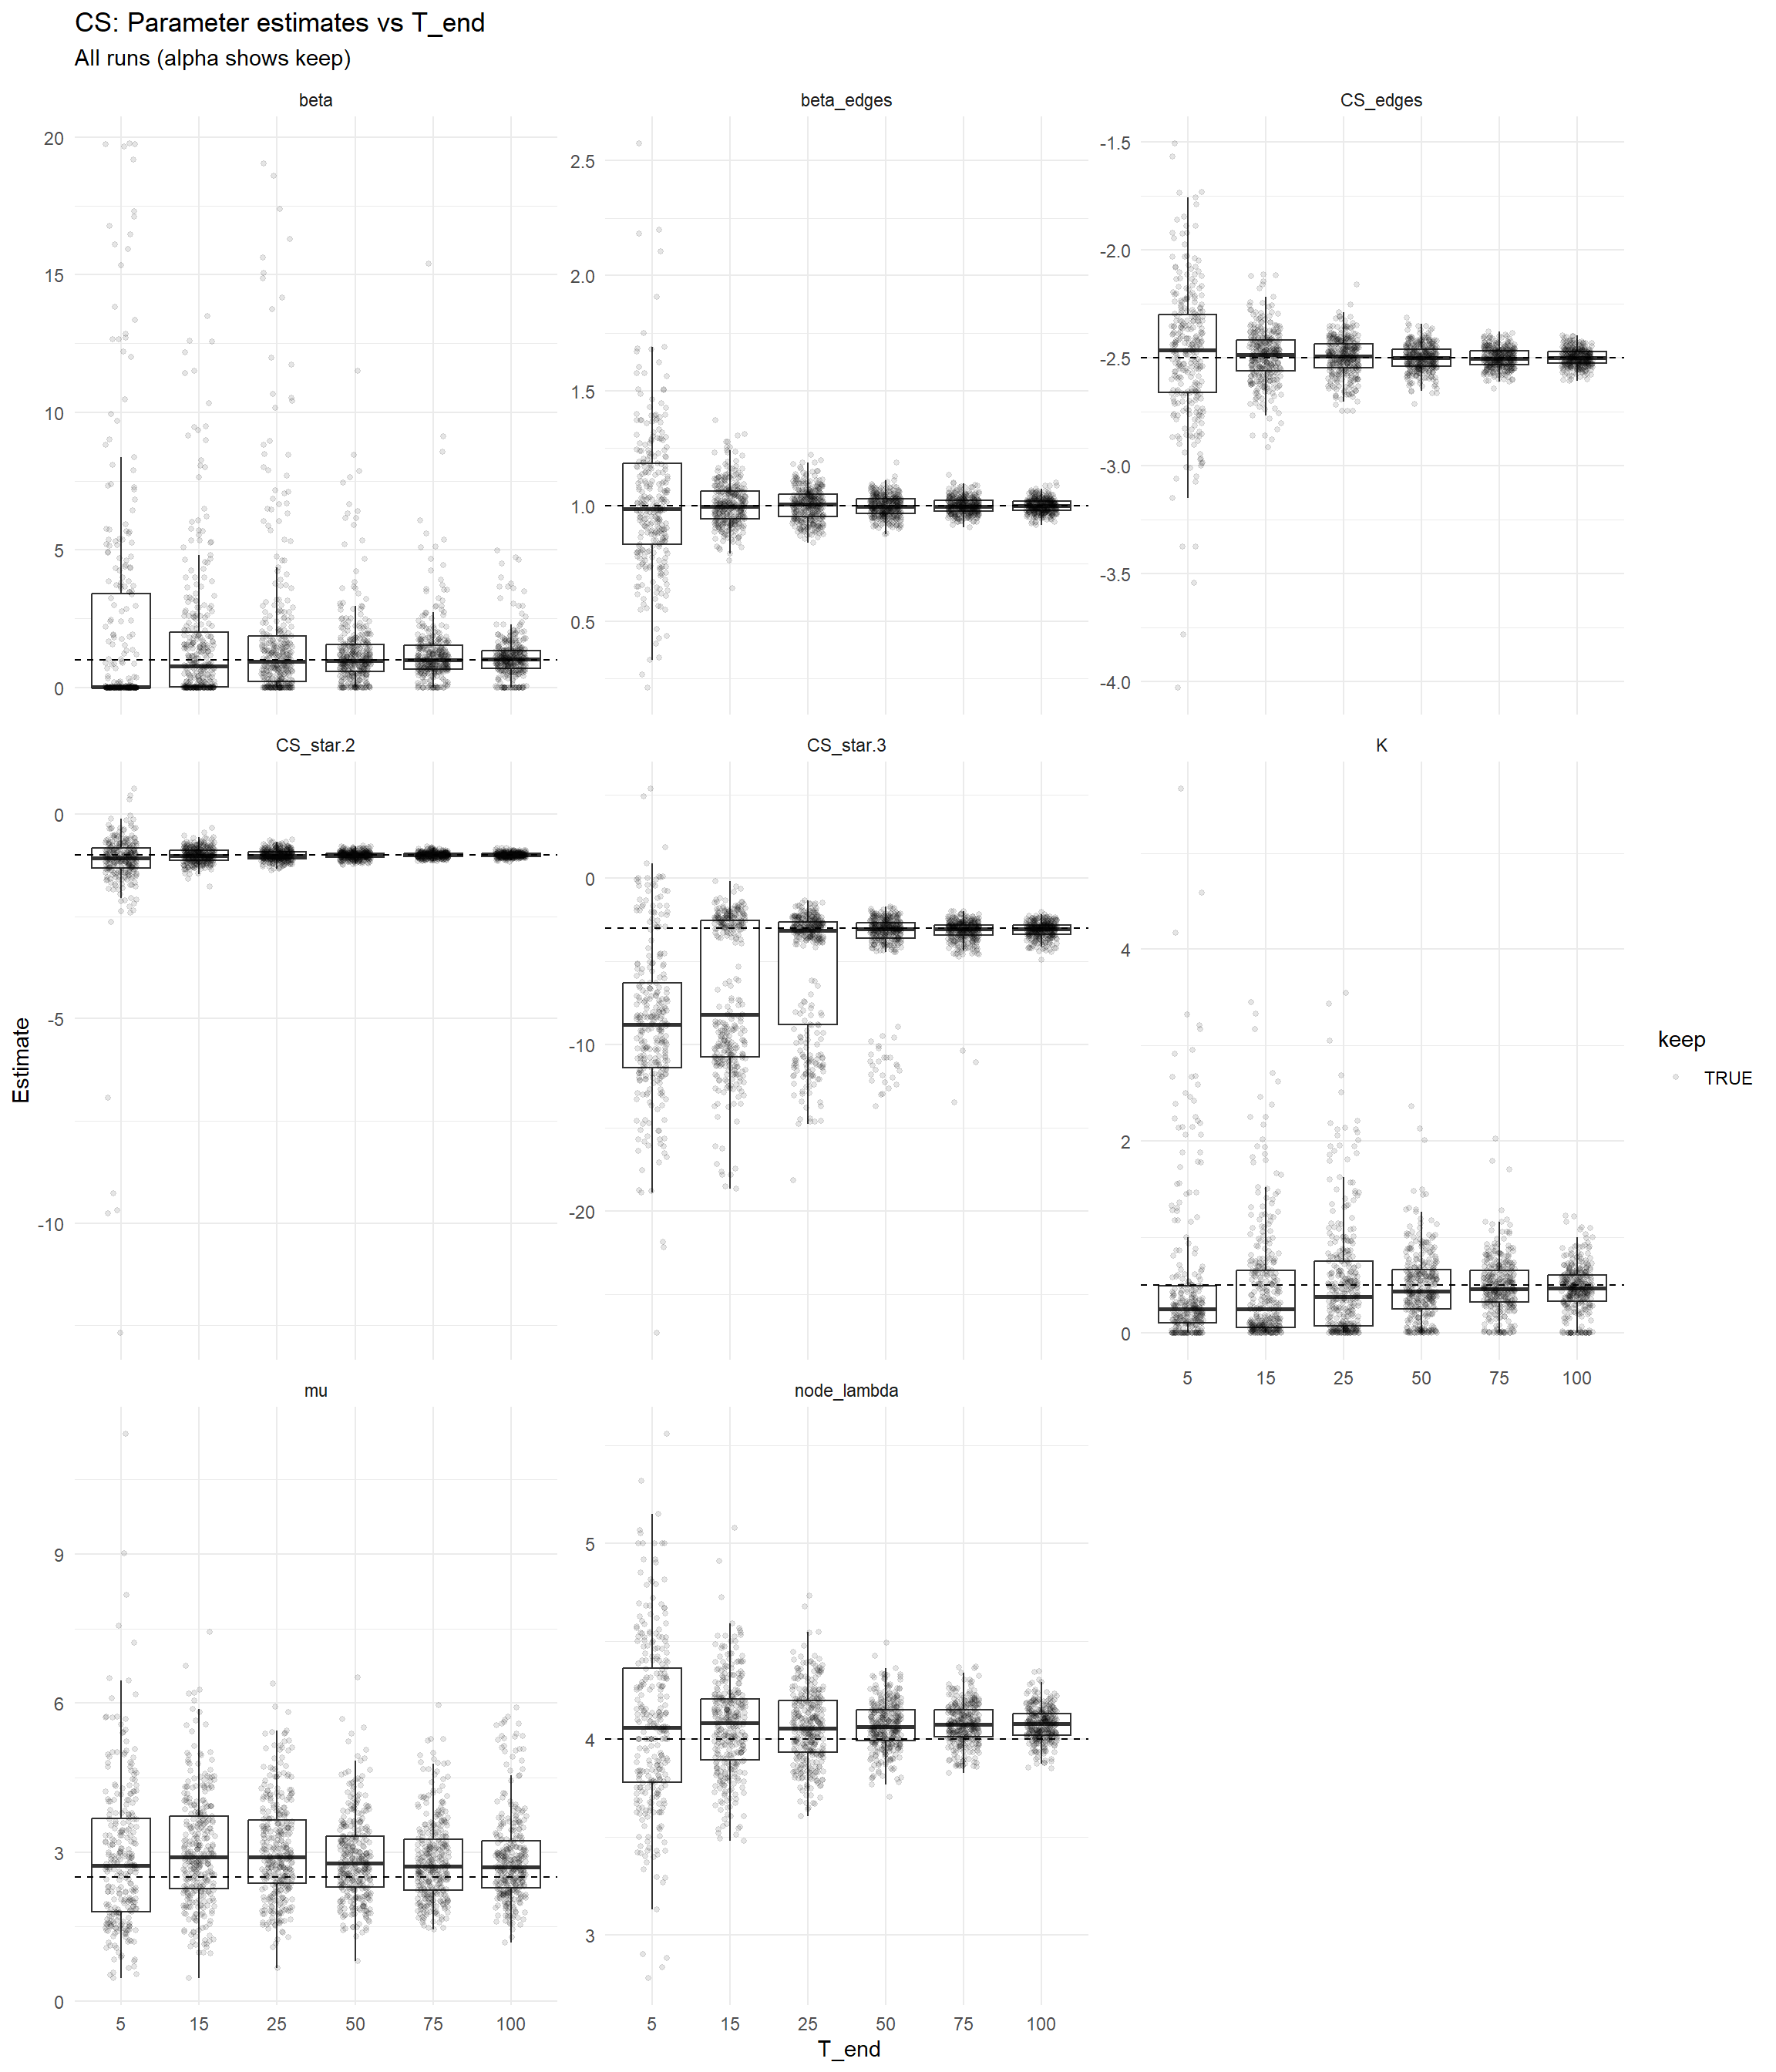
summary_table(df)
# A tibble: 6 × 7
  T_end     n keep_rate n_events_mean n_events_sd sim_s_mean fit_s_mean
  <dbl> <int>     <dbl>         <dbl>       <dbl>      <dbl>      <dbl>
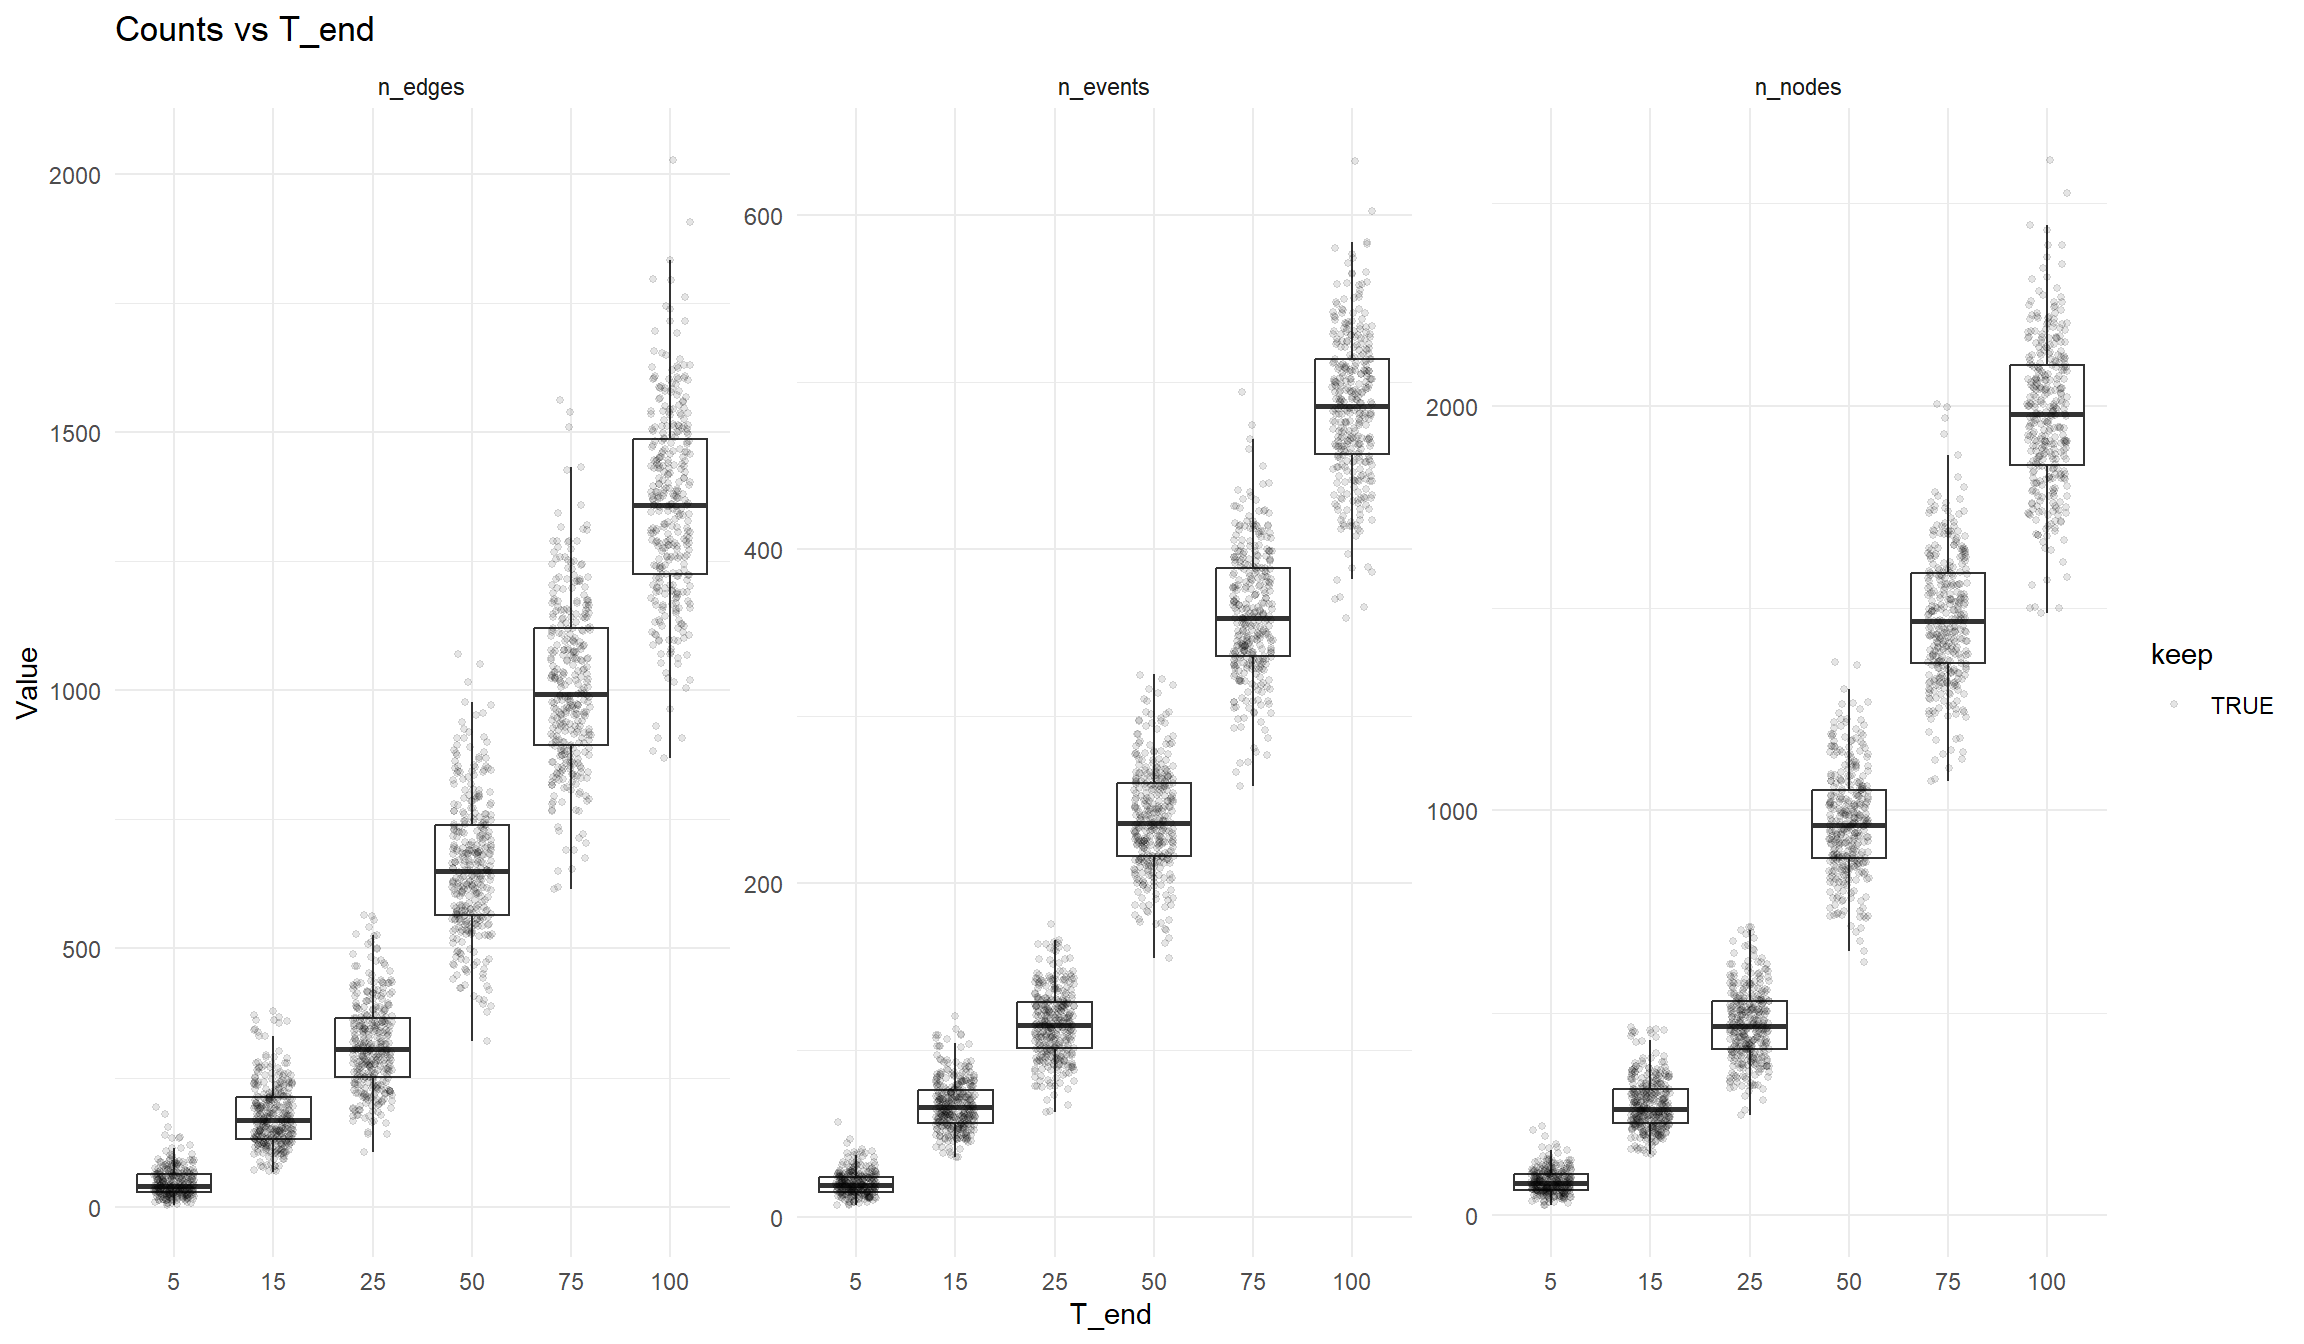
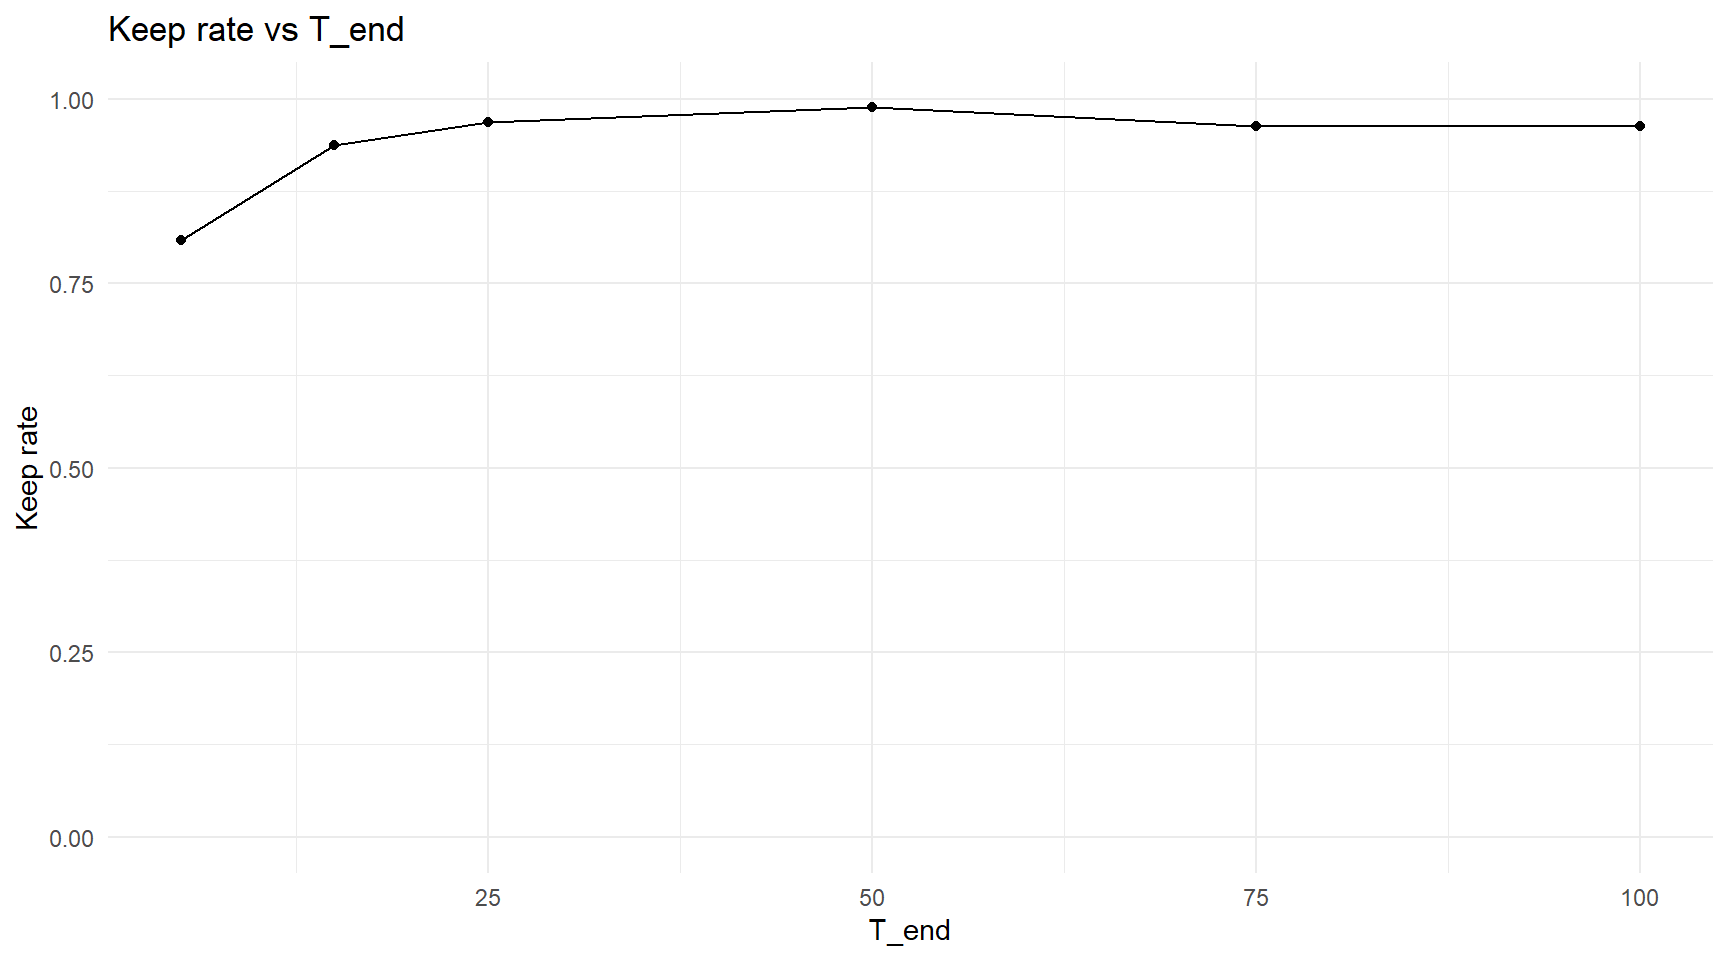
1     5   350     0.809          19.6        7.51        NaN        NaN
2    15   350     0.937          66.8       15.4         NaN        NaN
3    25   348     0.968         116.        20.5         NaN        NaN
4    50   346     0.988         238.        31.2         NaN        NaN
5    75   345     0.962         363.        38.0         NaN        NaN
6   100   346     0.962         484.        43.6         NaN        NaN

15.2 Cap-Exceeded Replicates

Filtering out explosive fits (same caps as BA on K/beta).

df %>%
  summarise(
    n_total = n(),
    n_keep  = sum(keep, na.rm = TRUE),
    n_dropped_caps = sum(drop_reason == "cap_exceeded", na.rm = TRUE)
  )
# A tibble: 1 × 3
  n_total n_keep n_dropped_caps
    <int>  <int>          <int>
1    2085   1955            130
df_non_filtered <- df

df <- df %>% filter(keep)

15.3 Parameter estimates vs T_end

Dashed line = true value.

plot_estimates_vs_T_cs(df, log_scale = FALSE)

15.4 RMSE decay vs T_end

Note

Look at mu here, what is going on? Will wait to see the final version of the paper you guys publish and see. Maybe it’s just a CS thing?

plot_rmse_vs_T_cs(df)

15.5 Counts vs T_end

plot_counts_vs_T(df)

15.6 Keep rate vs T_end

plot_keep_rate_vs_T(df_non_filtered)

15.7 Runtime vs T_end

Runtime didn’t get saved for the CS sim studies. Was similar to BA BIP.