This page summarizes the BA kernel simulation study results saved as per-replicate .rds files under:
sim_study_results/ba/ba_run_<jobid>/ba_rep_###.rds
Each replicate contains truth, estimates, counts, and runtimes (see str(ba_rep_003)).
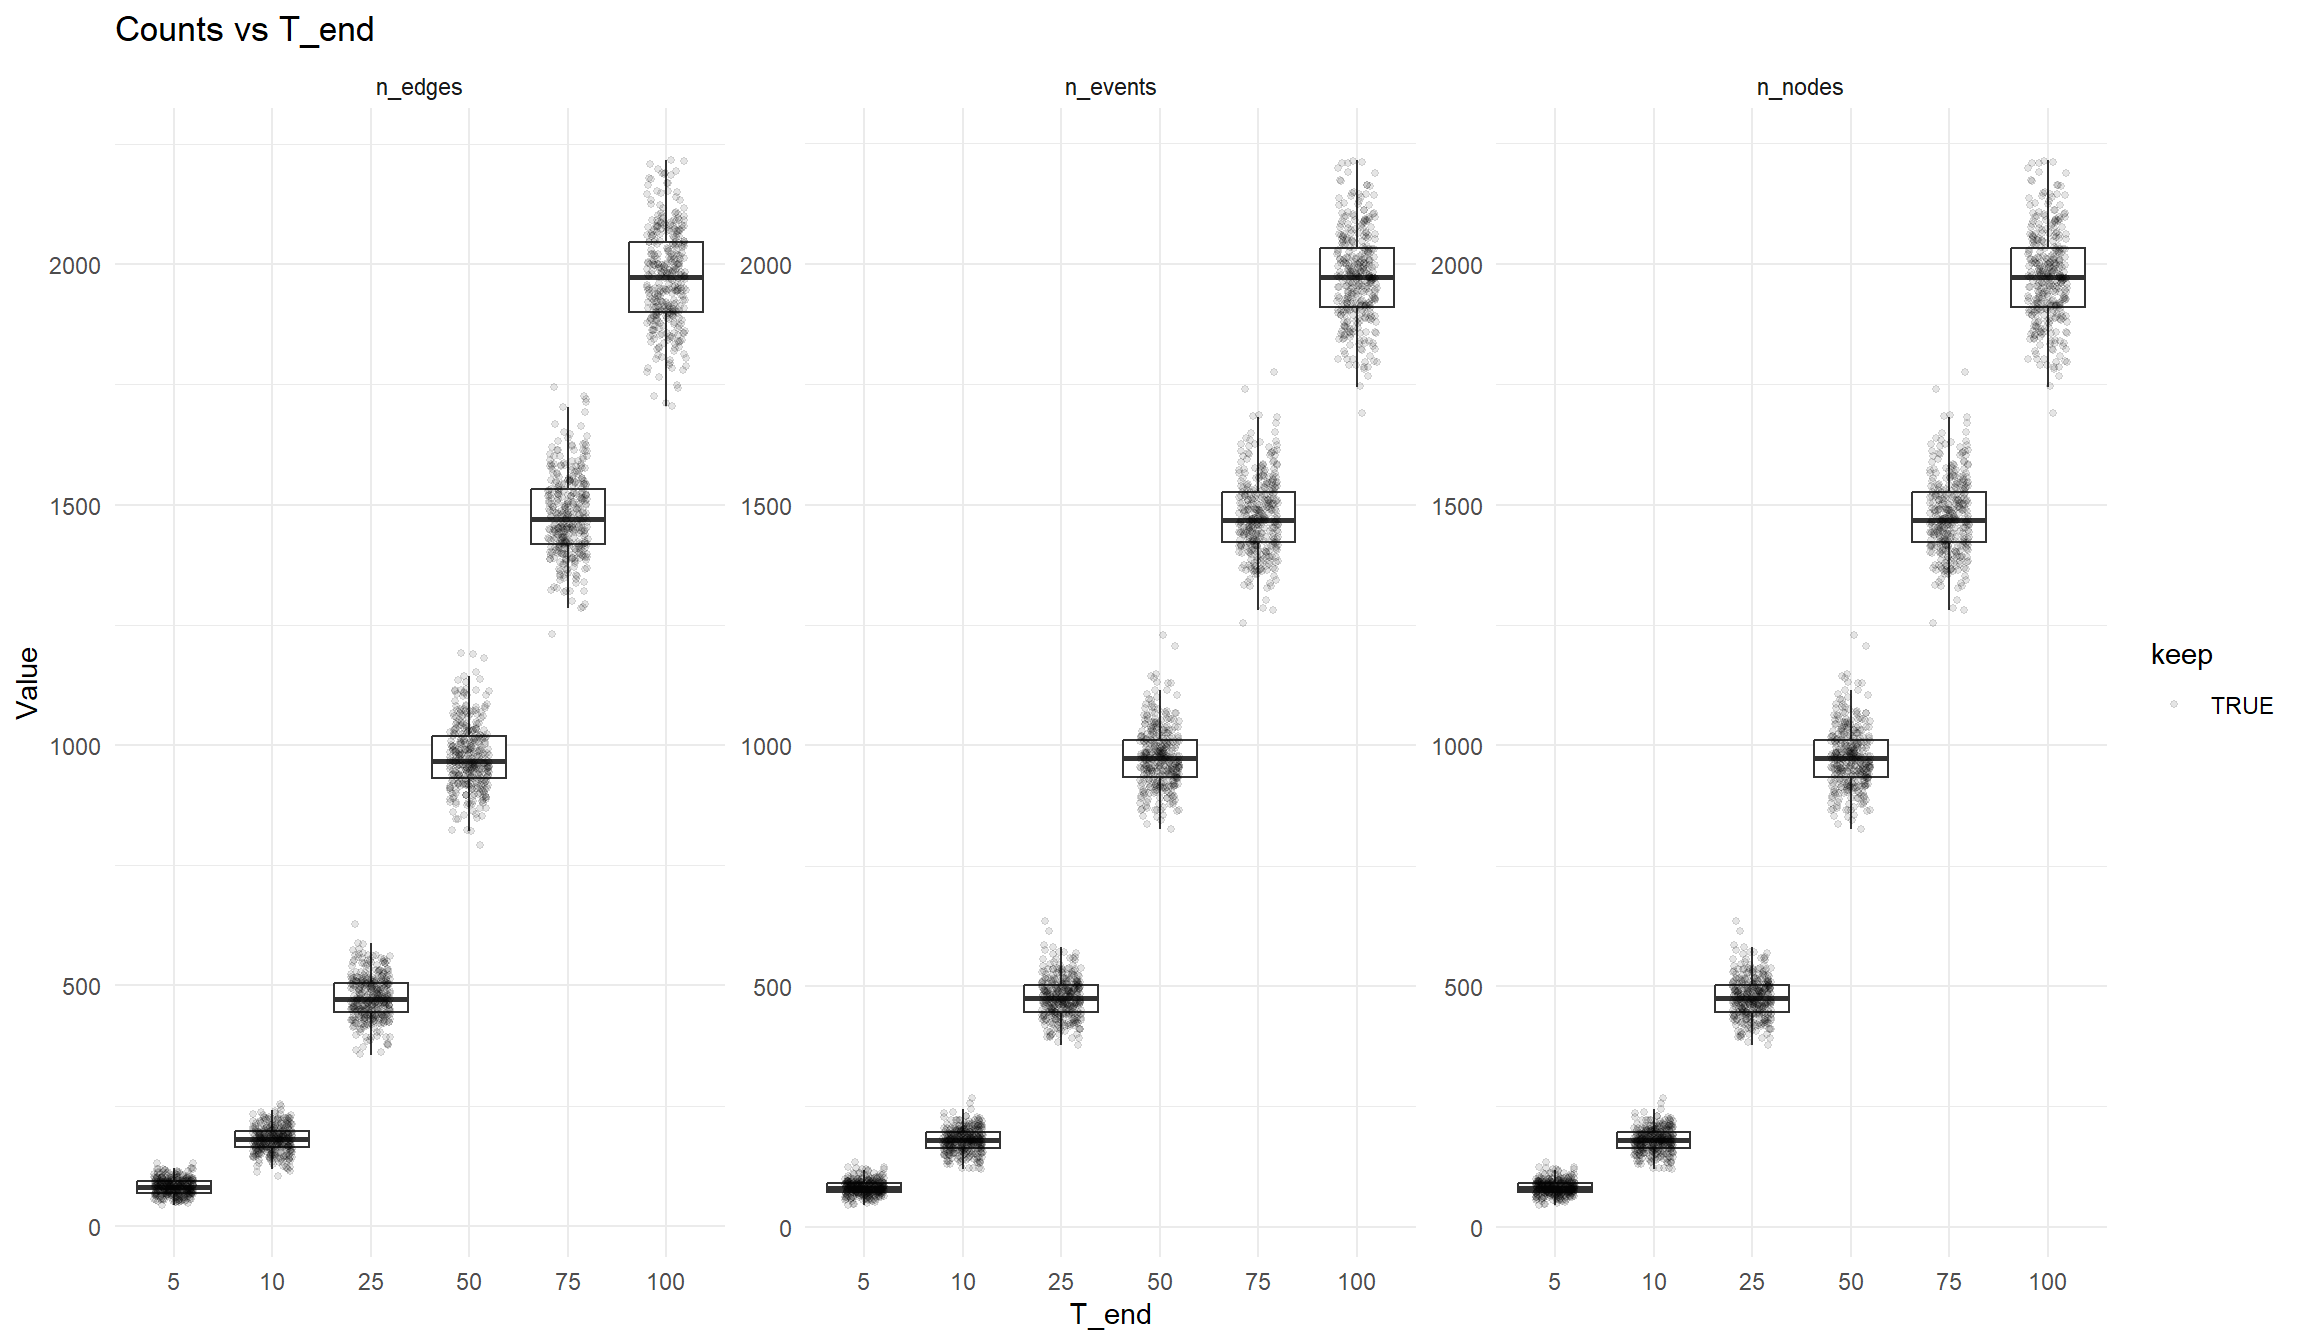
Quick summary
<- summary_table (df)
# A tibble: 6 × 7
T_end n keep_rate n_events_mean n_events_sd sim_s_mean fit_s_mean
<dbl> <int> <dbl> <dbl> <dbl> <dbl> <dbl>
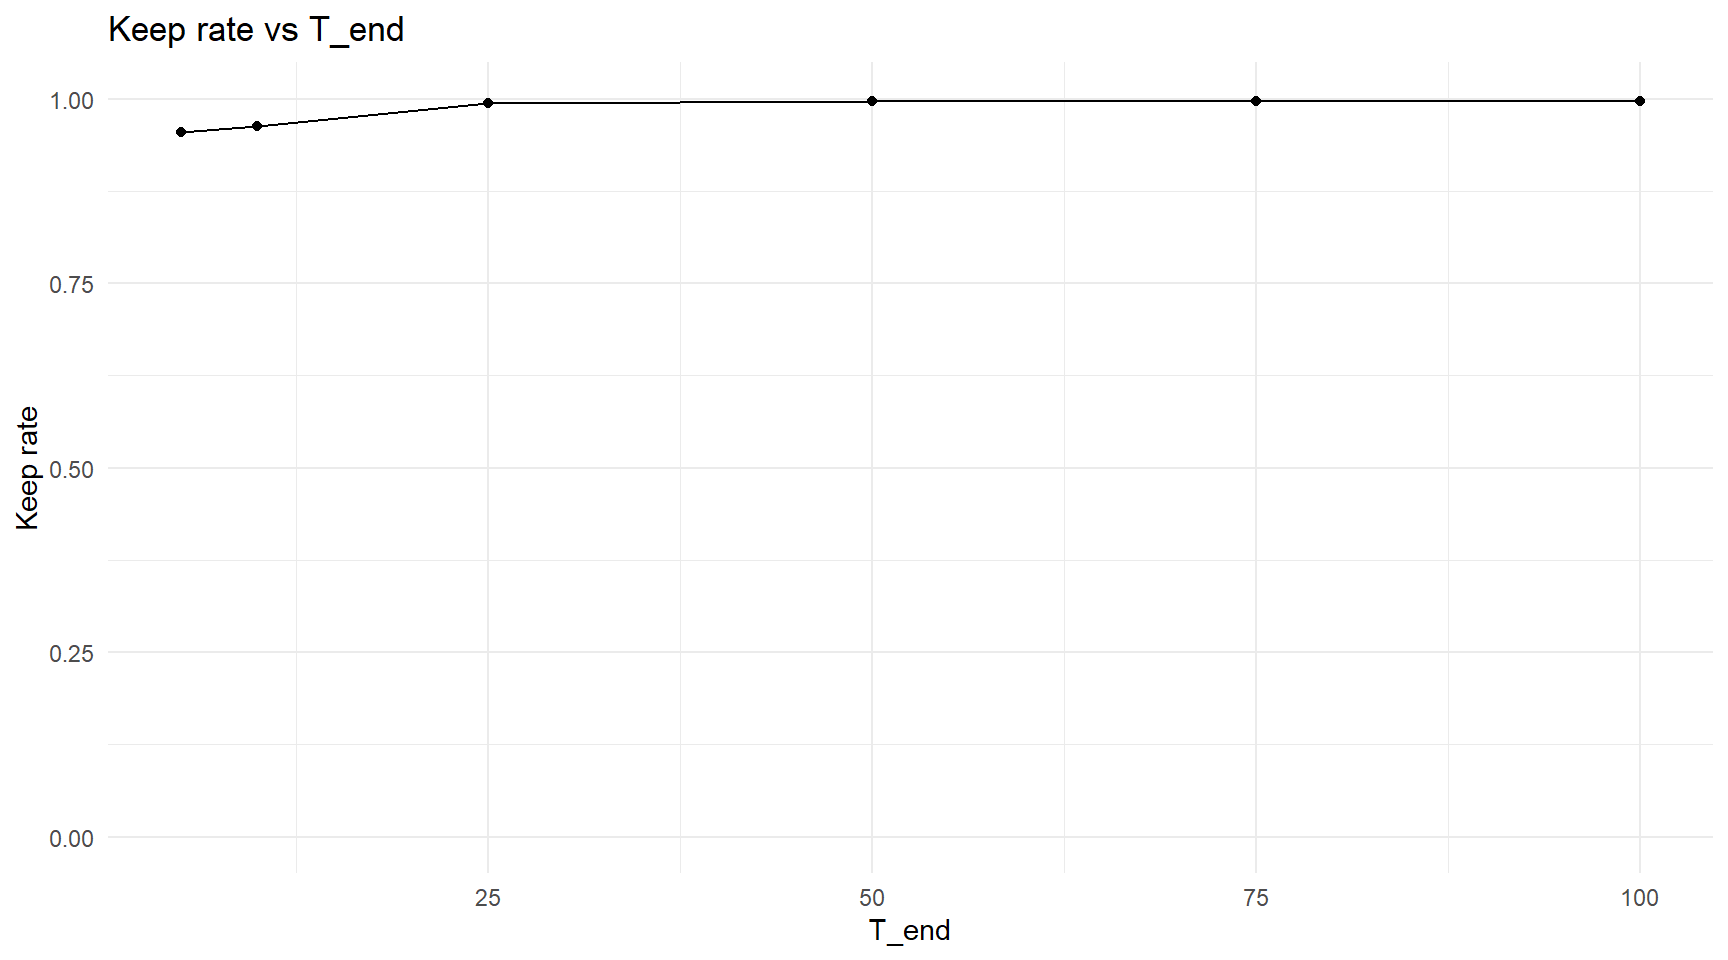
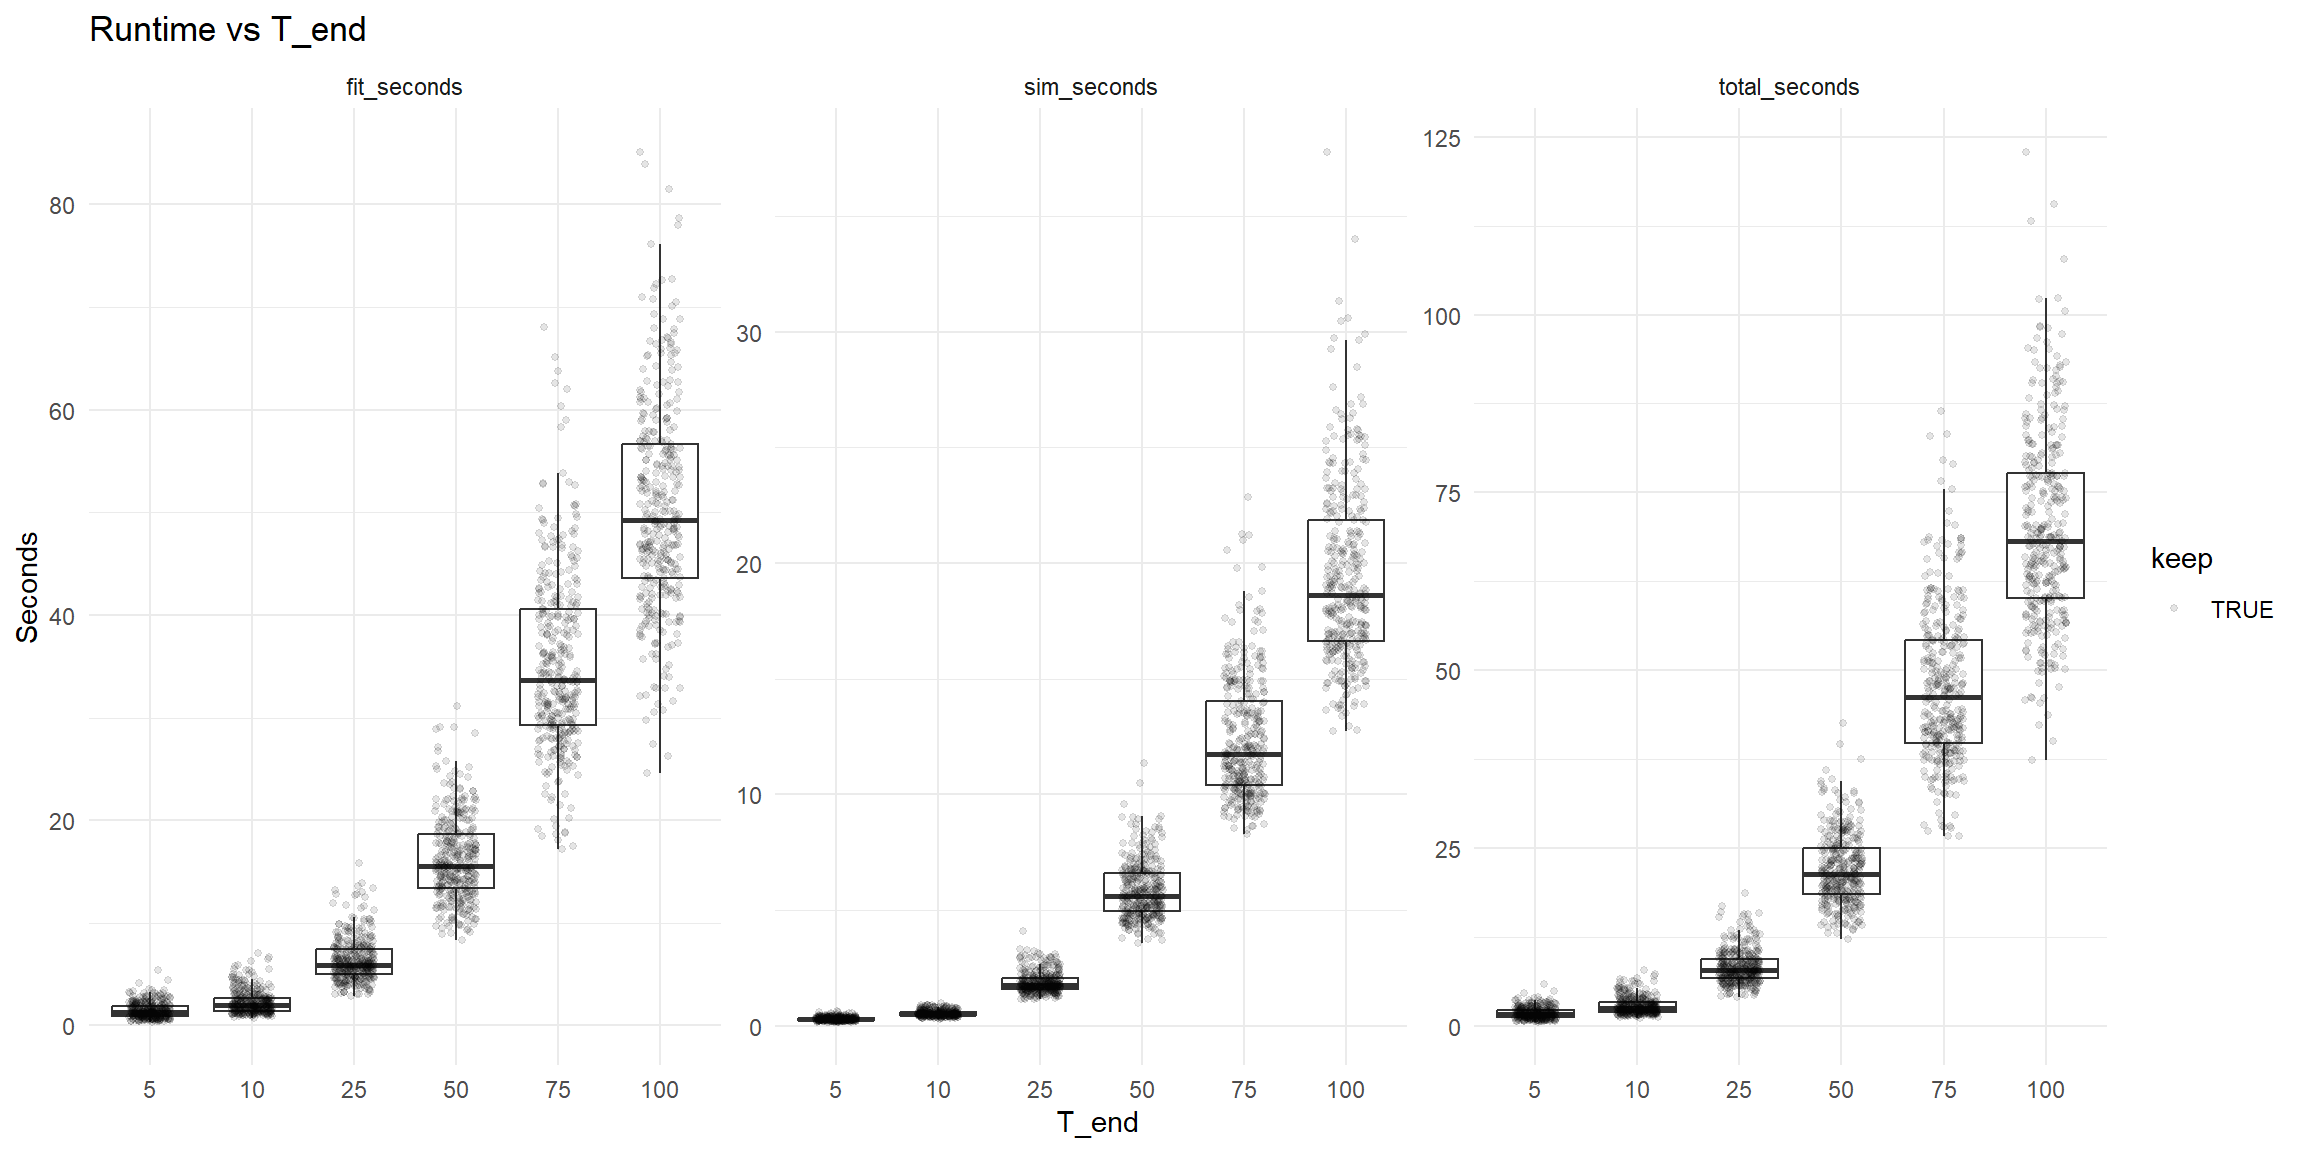
1 5 350 0.954 81.5 14.6 0.297 1.46
2 10 350 0.963 180. 24.3 0.530 2.30
3 25 350 0.994 476. 41.2 1.88 6.46
4 50 350 0.997 975. 62.8 5.86 16.2
5 75 350 0.997 1476. 79.5 12.4 35.3
6 100 350 0.997 1973. 94.2 19.4 50.7
Cap-Exceeded Replicates
There were a few replicates which “exploded”, and ended up with unrealistic estimates of K & beta. I decided to just filter these out, as it was making the plots unreadable.
Chose to filter out any \(K > 20\) , \(\beta > 20\) (arbitrarily).
%>% summarise (n_total = n (),n_keep = sum (keep, na.rm = TRUE ),n_dropped_caps = sum (drop_reason == "cap_exceeded" , na.rm = TRUE )
# A tibble: 1 × 3
  n_total n_keep n_dropped_caps
    <int>  <int>          <int>
1    2100   2066             34
<- df<- df %>% filter (keep)
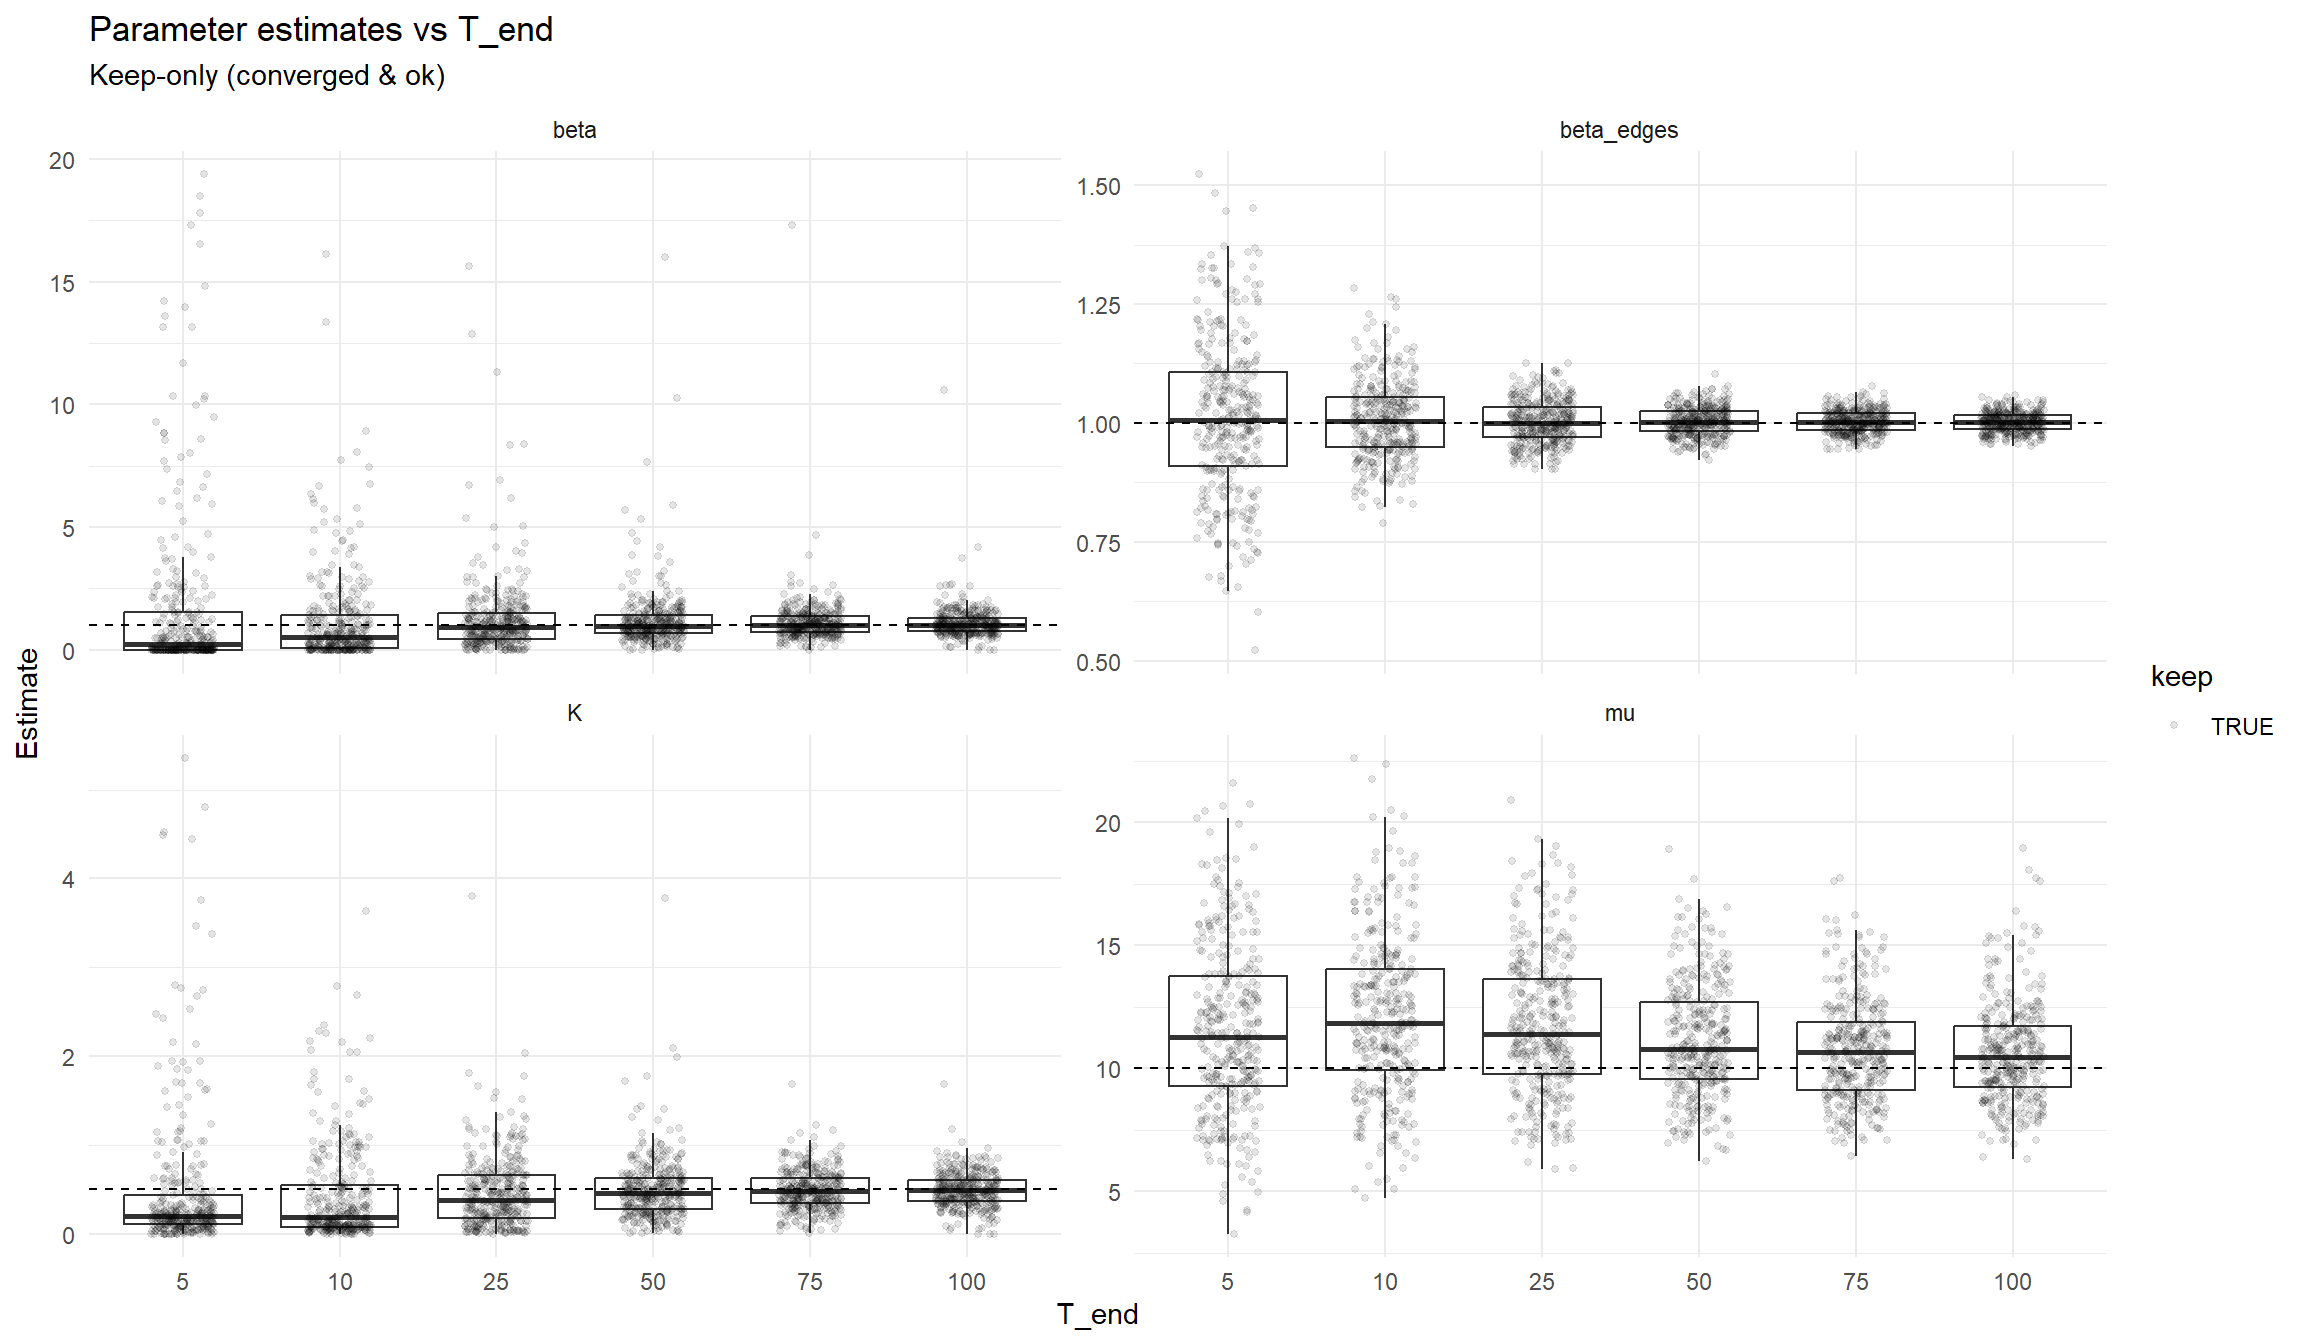
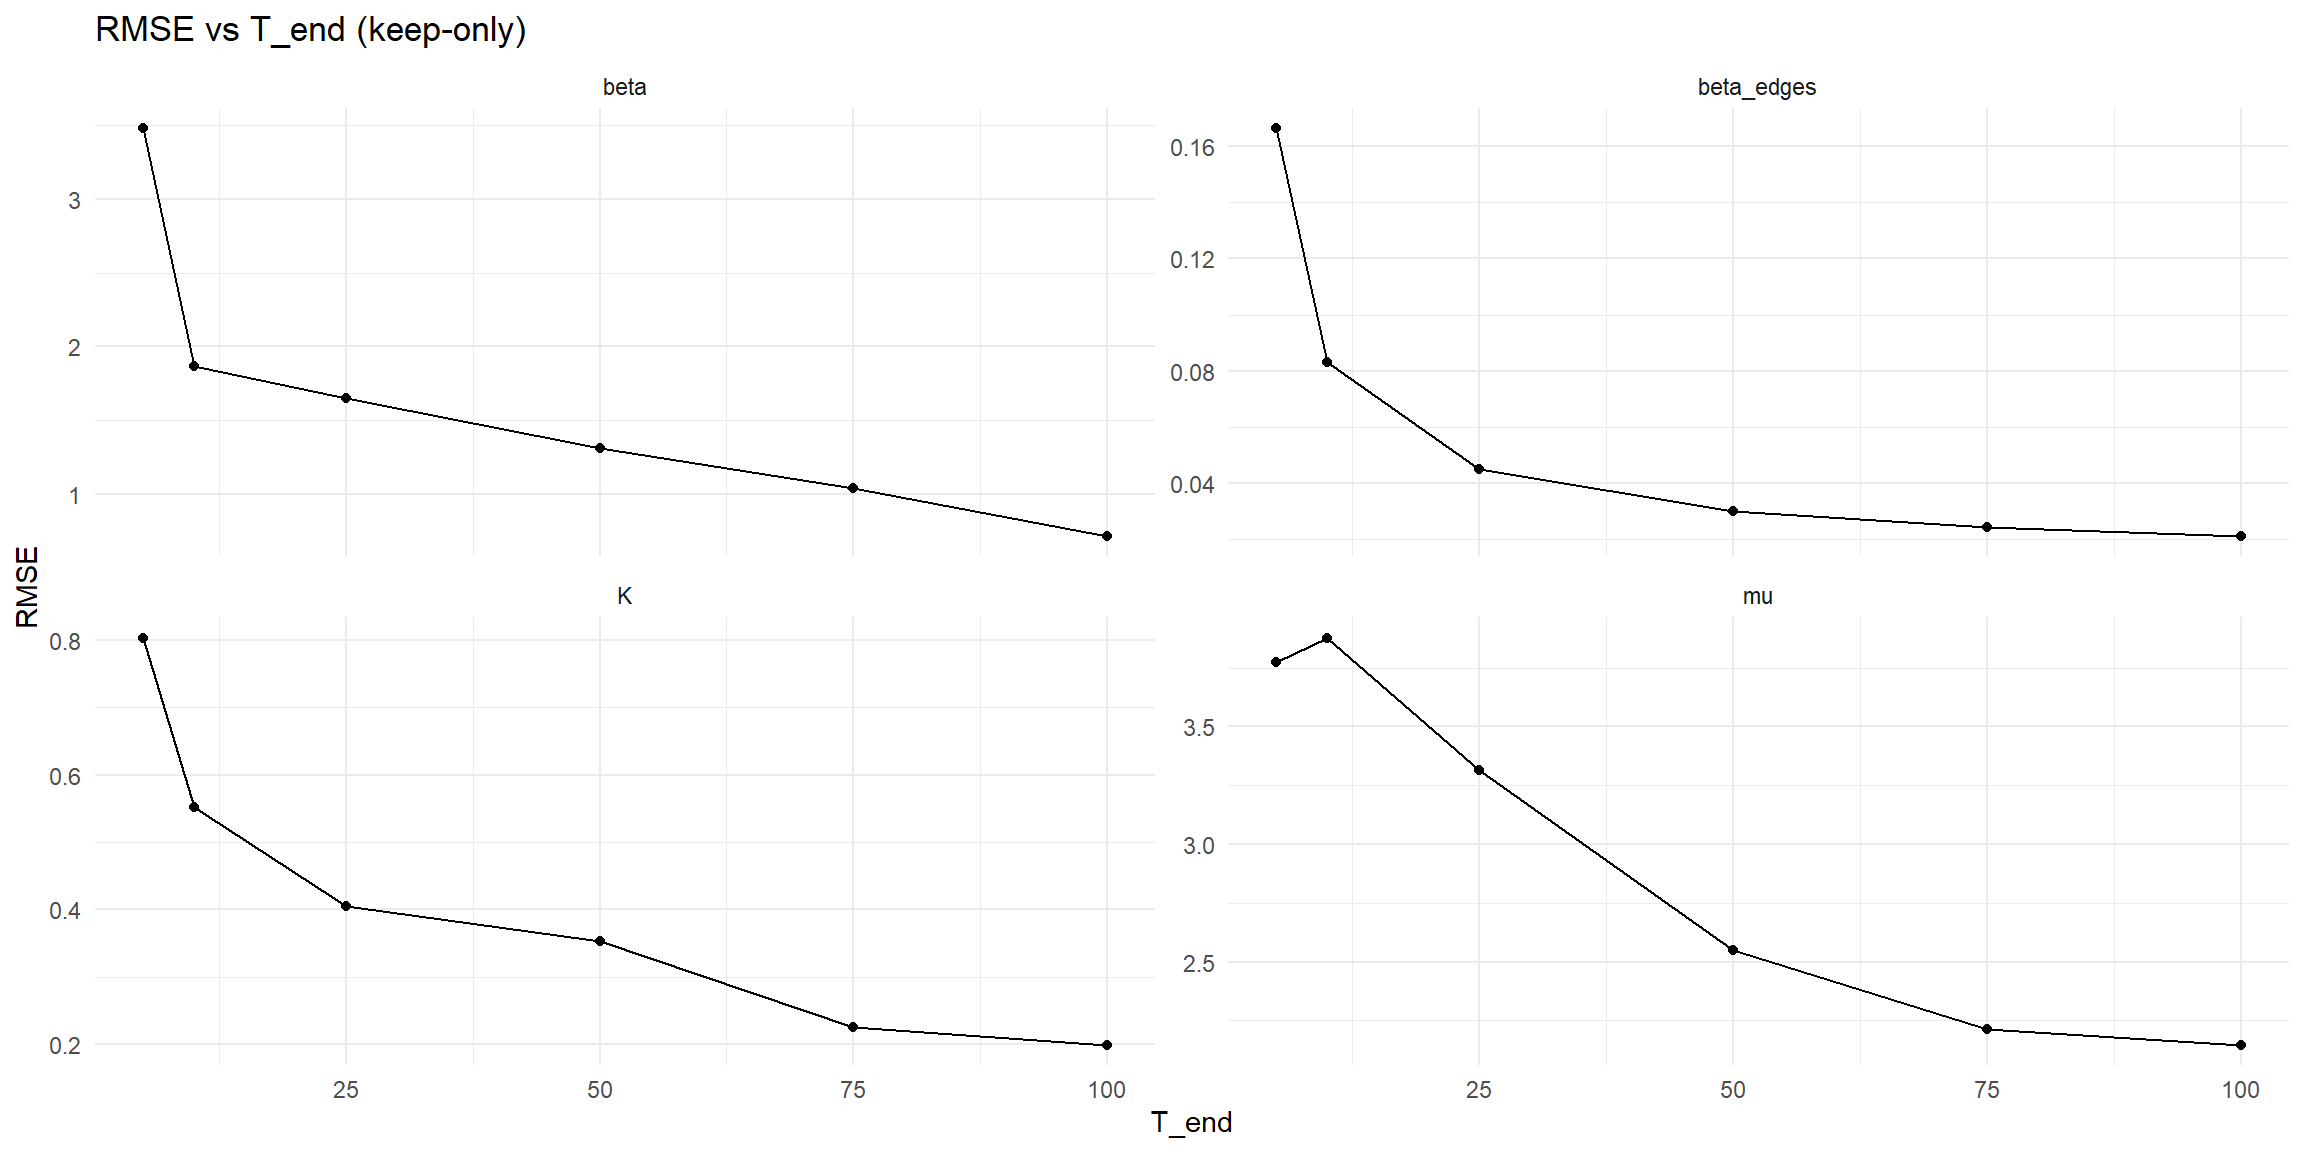
Parameter estimates vs T_end
Dashed line = true value.
plot_estimates_vs_T (df, keep_only = TRUE )
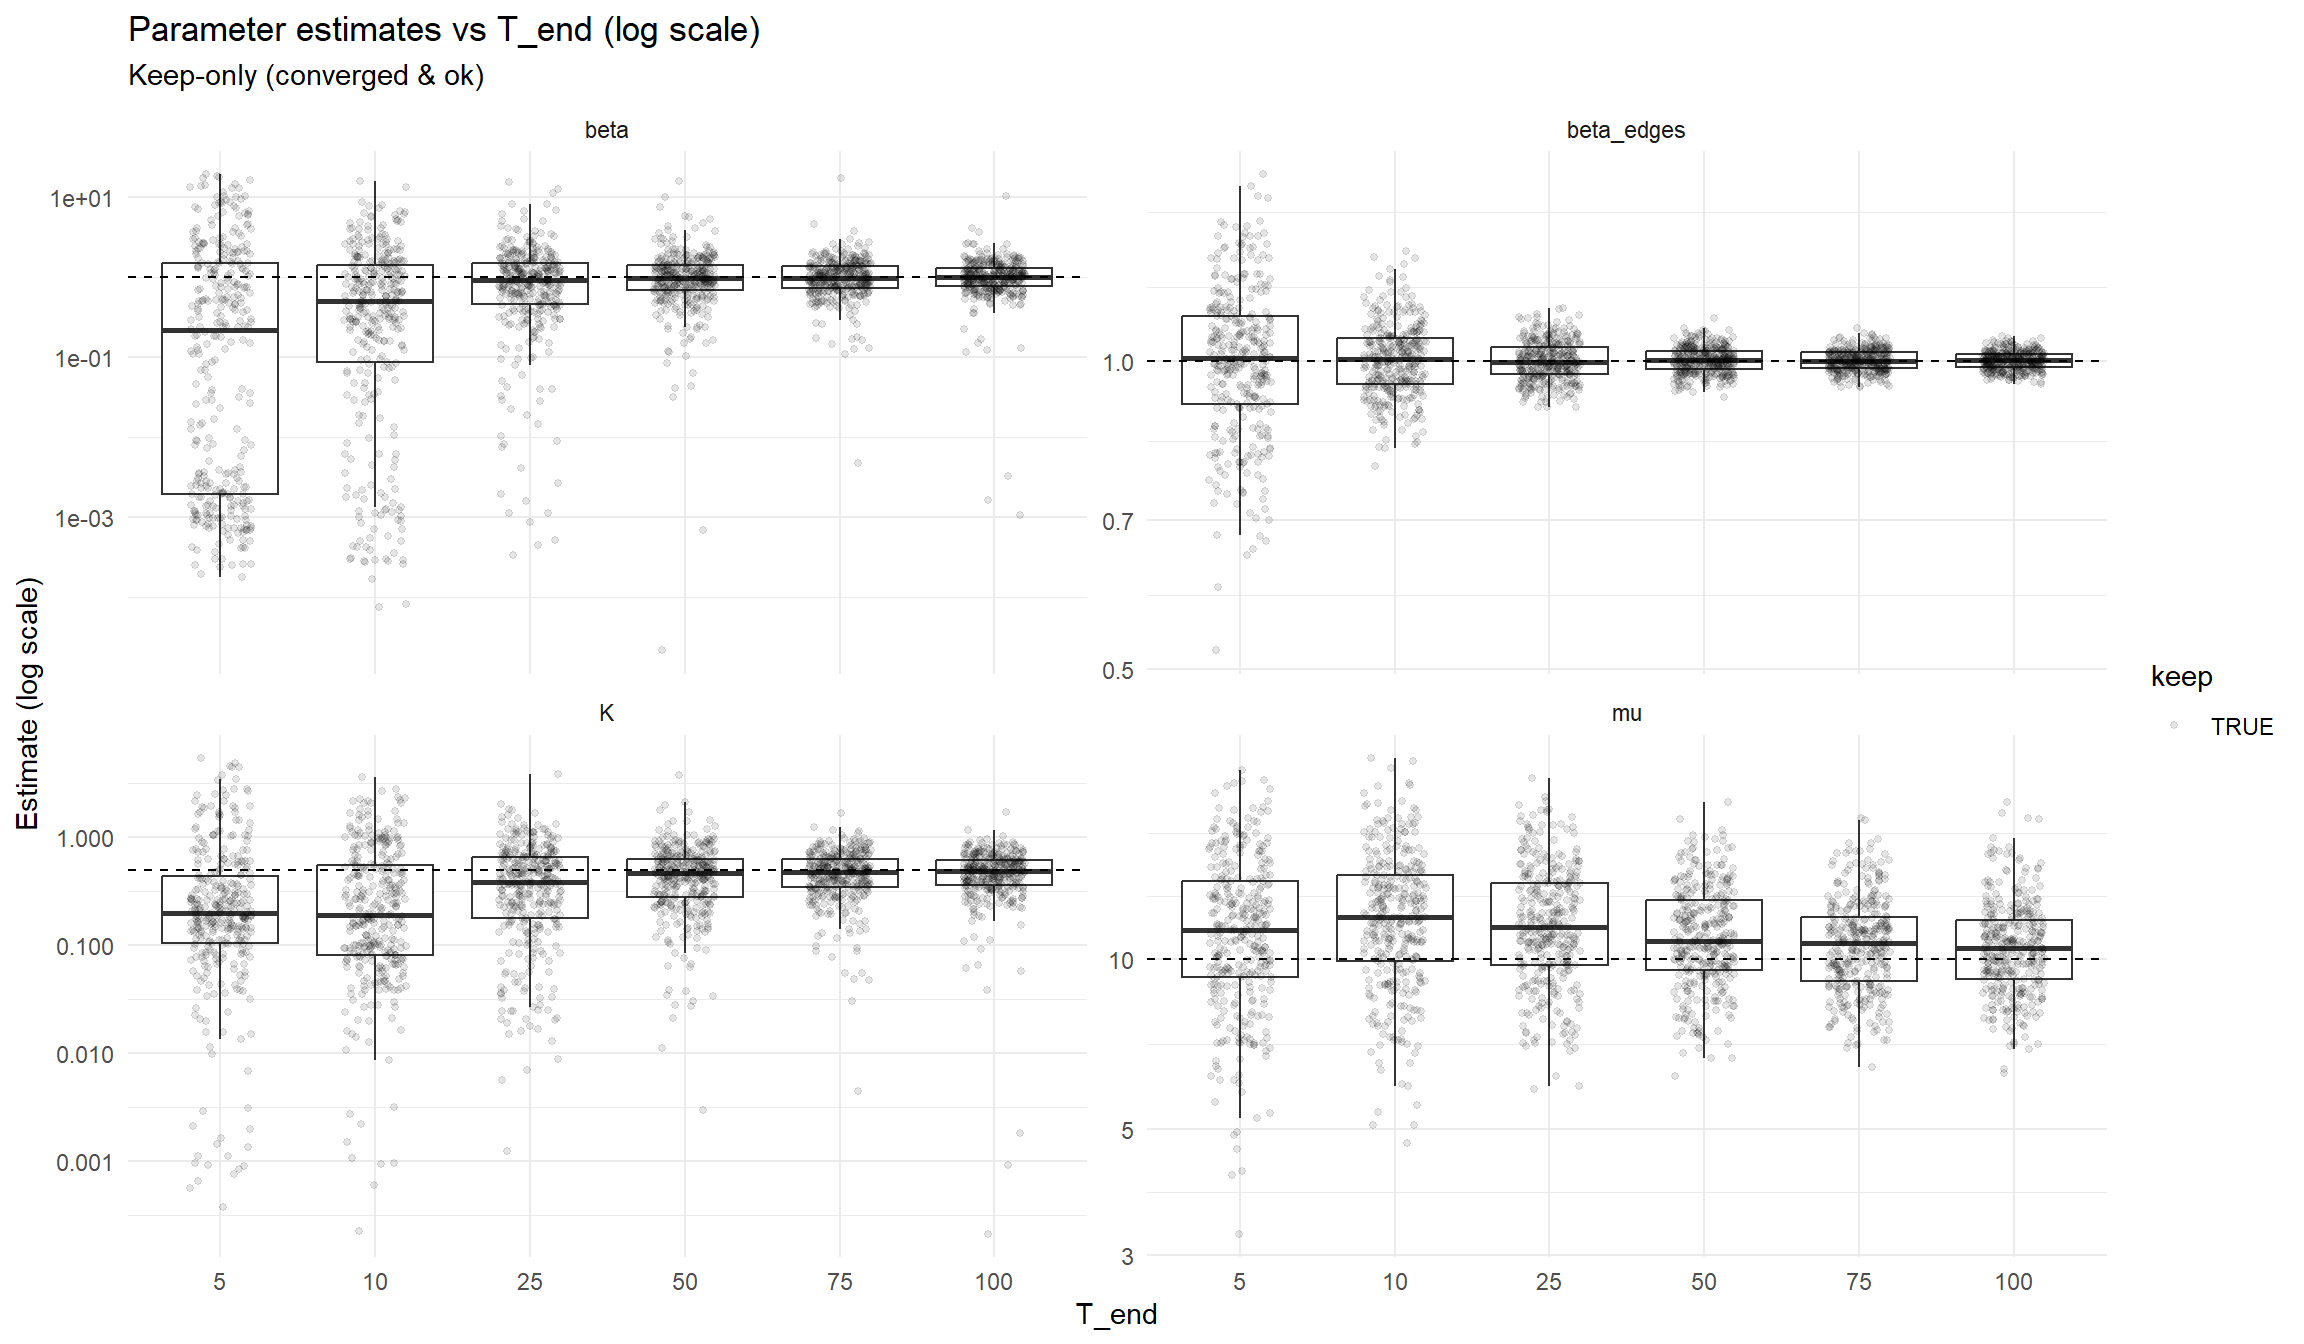
Log scale:
plot_estimates_vs_T (df, keep_only = TRUE , log_scale = TRUE )
Keep rate vs T_end
plot_keep_rate_vs_T (df_non_filtered)